Online gambling has emerged as a major attraction for Australians in the recent past. While it seems entertaining, gambling has its share of disadvantages. Looking at the recent developments in the iGaming market across Australia, we have conducted thorough research on gambling in the continent. We have reviewed how the Australian gambling industry evolved, revenue trends, per capita expenditure on gambling, and player participation rate basis the products and gender.
Popular Gambling Among the Australian Population
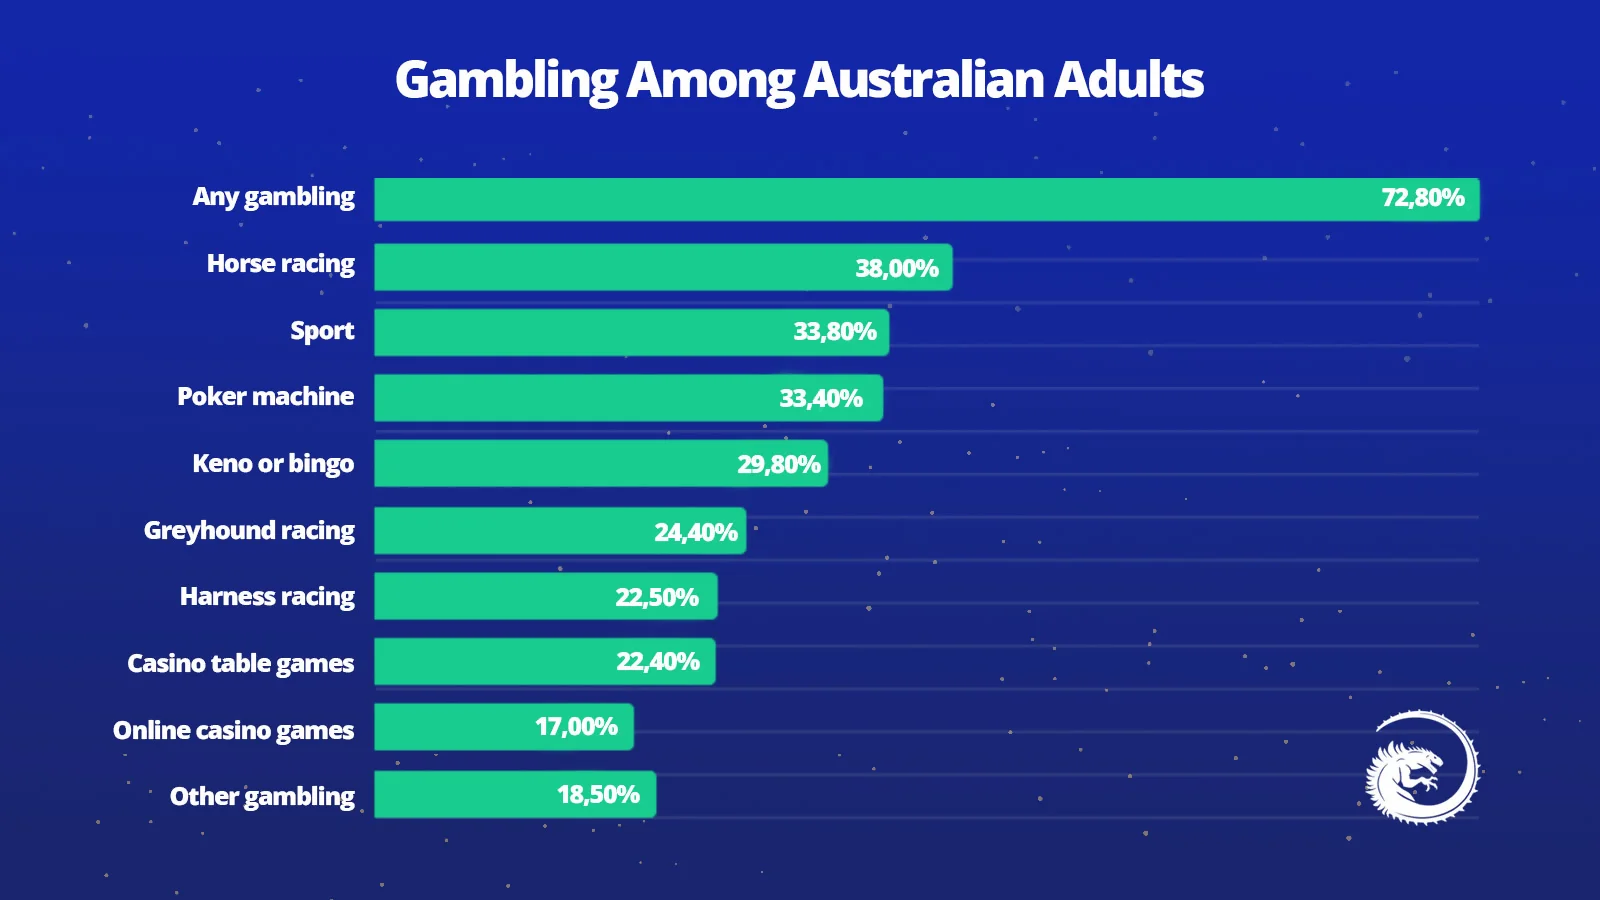
Ever since the establishment of the first casino in Australia, most gambling ambits have allowed only individuals over 18 years old to play at the casino. However, the Australian state has seen a variance in adult gambling preferences or the money they spend on different gambling services. As reported by the Australian Institute of Family Studies (AIFS) in March 2023, nearly 73% of the adult population was involved in money gambling activities.
Adult Australians gambled on varied gambling products that comprised lotteries (64%), different kinds of races including horse race betting, harness racing, greyhound racing (24,4%), poker machine (33,4%) and many other casino table games (22,4%) and sports betting activities (34%). In the chart below you will find more detailed about adult involvement into he different gambling categories.
Adults Gambling Participation Rate: Product and Gender-Wise
Statistics of gambling indicate that the gambling frequency among Australian men is higher than that of women. Men spend more money on almost every gambling product available in the market. Hence, they are more prone to risk, both financially as well as mentally.
Insights from Age and Preferences
According to the same report, the average age of Aussie men who recently gambled was 39. While non-problem gamblers constituted the majority, people at low, moderate and high risk comprised almost 27.1% of the men’s gambling population. Horse racing appeared as one of the most popular betting sports among adults in Australia. AGRC reported that 64% of Australian adults gambled on lottery and scratchies, while 39% of the gambling population contributed to race betting, 34% on sports betting and 33% on pokies.
Moreover, among men, the trend hinted at relatively younger men between 32 and 33 years spending more on esports and fantasy sports. Men in the age group of 39 years appeared to be more fascinated by sports betting and poker gaming, while those around 41 preferred horse racing.
Revenue Contribution of the Australian Gambling Industry
Funds from gambling taxes collected by the state make up solid economic contributions. These hugely contribute to the state fund schemes to establish gambling help services and promote responsible gambling initiatives. According to the latest study conducted by the Australasian Gaming Council (AGC), online casinos, horse racing, sports betting, lotteries, gaming and vending machine manufacturers heavily contributed to the economy by generating employment.
As per Australian online gambling statistics compiled by AGC, here’s a glimpse of the economic contributions made by the Australian gambling industry in 2019-20:
- Casinos contributed $2,491 million
- Gaming and vending machine manufacturers contributed $216 Million
- Horse and dog racing contributed $778 Million
- Horse and sports betting contributed $1,259 Million
- Lotteries contributed $1,995 Million
It is reported the ACT Gambling and Racing Commission collected a total of $2,273,000 from the gambling industry. This amount was diversified into the following funds:
| Fund | Amount (Australian Dollars) |
|---|---|
| Gambling Harm Prevention and Mitigation Fund | $1,251 million |
| Chief Minister’s Charitable Fund | $0.269 million |
| Diversification and Sustainability Support Fund | $0.753 million |
| Open grants to the community | $386,676 |
| Gambling help services and counselling | $11,571,424 |
| Gambling Research | $1,017,813 |
| Community Benefit Payment Scheme | $1,050,401 |
Per Capita Gambling Expenditure in Australia
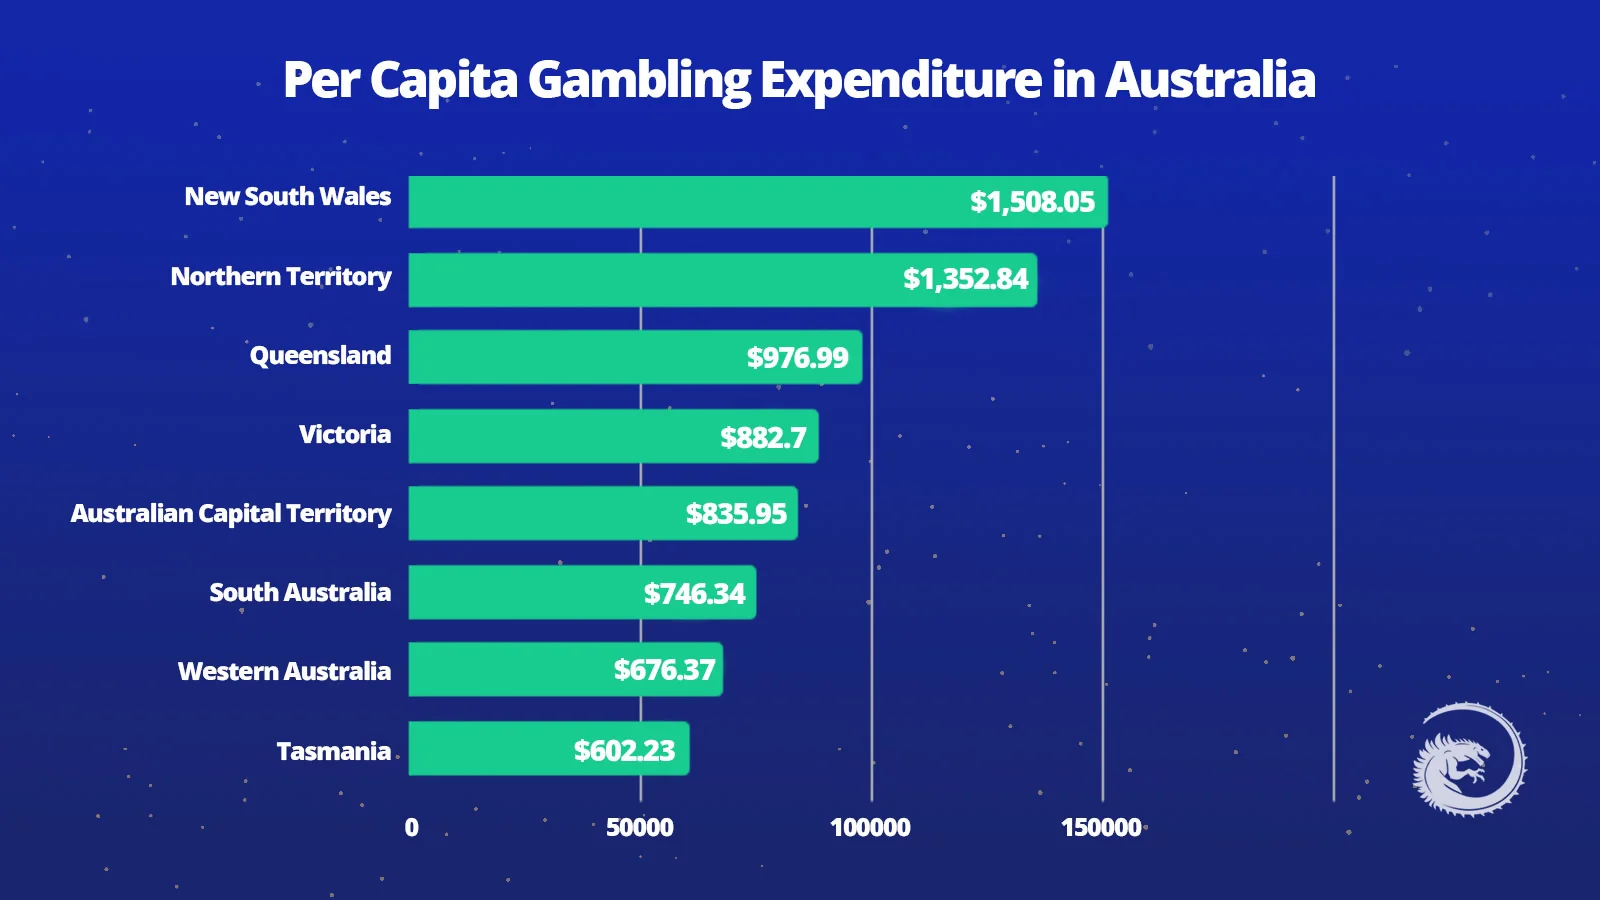
A report published by the Australasian Gaming Council revealed that the total gambling expenditure was recorded as $21,243 Million in 2019-20. Expenditure on Gaming Machines was recorded at $3,514 Million; it was $2,624 Million on lotteries, $306 Million on Keno, $29 Million on Minor Gaming and $3.8 Million on Interactive Gaming. Here what’s the per capita gambling expenditure across each state in Australia looked like:
In another report by the Statista Research Department, indicated that NSW recorded the highest per capita gambling expenditure in Australia for FY 2020 at $1,508.05.
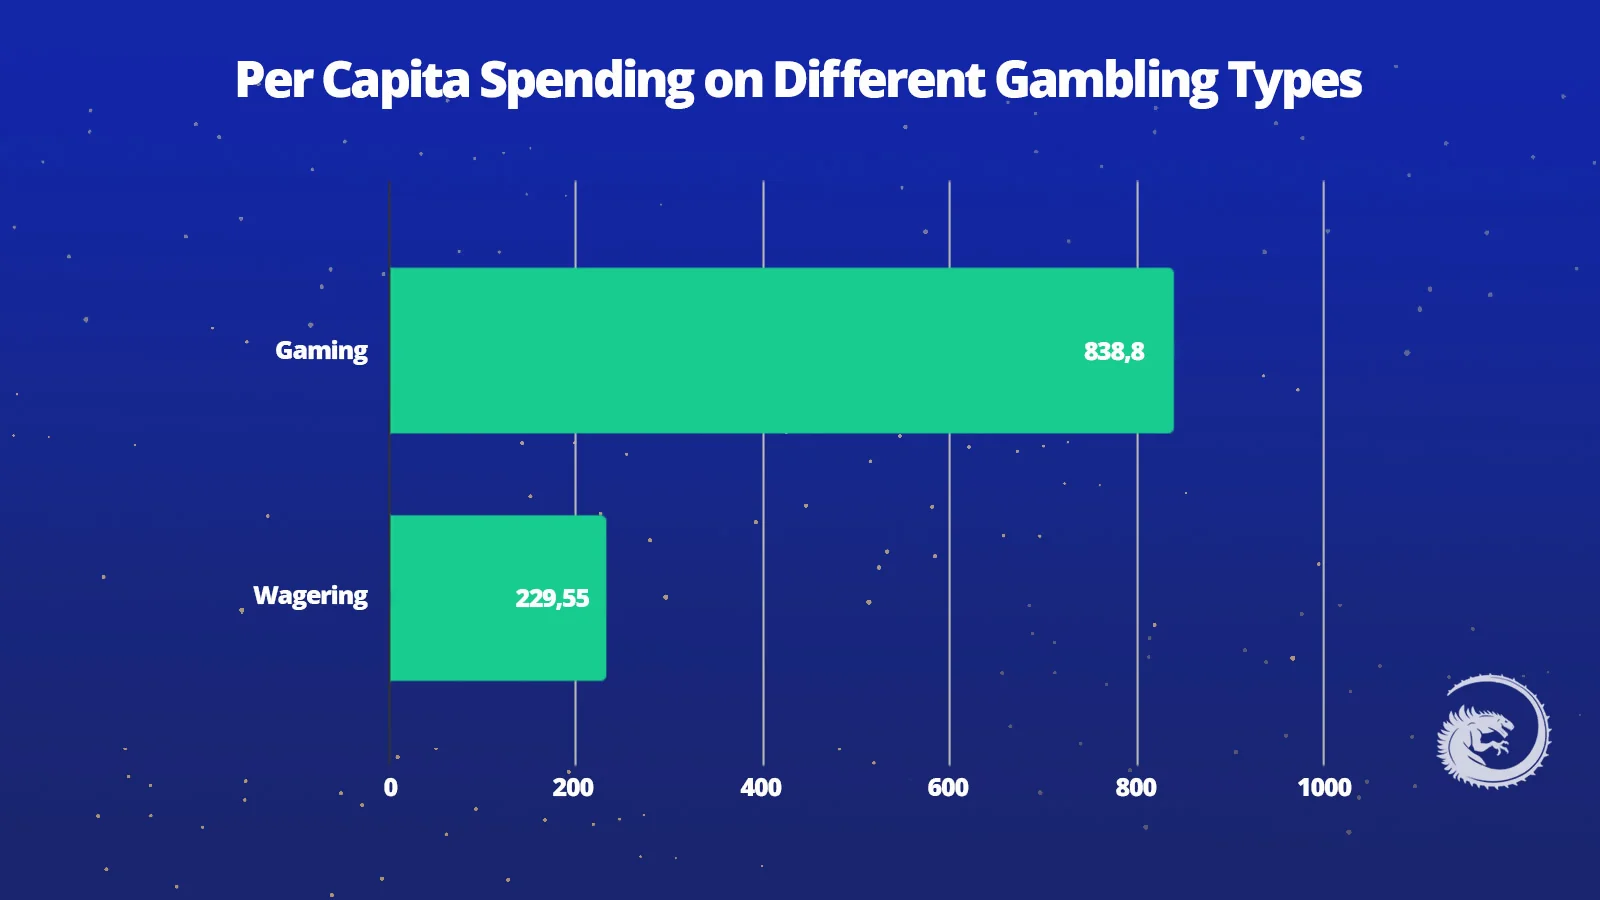
As per the report on gambling type published on March 8, 2020, by the Statista Research Department, the per capita expenditure on ‘Gaming’ in Australia amounted to $838.18 in FY 2020. It includes lotteries, casinos, lotteries and other interactive gaming. The per capita expenditure on ‘Wagering’ accounted for $229.55.
Australians Preferred Mode of Access by Device
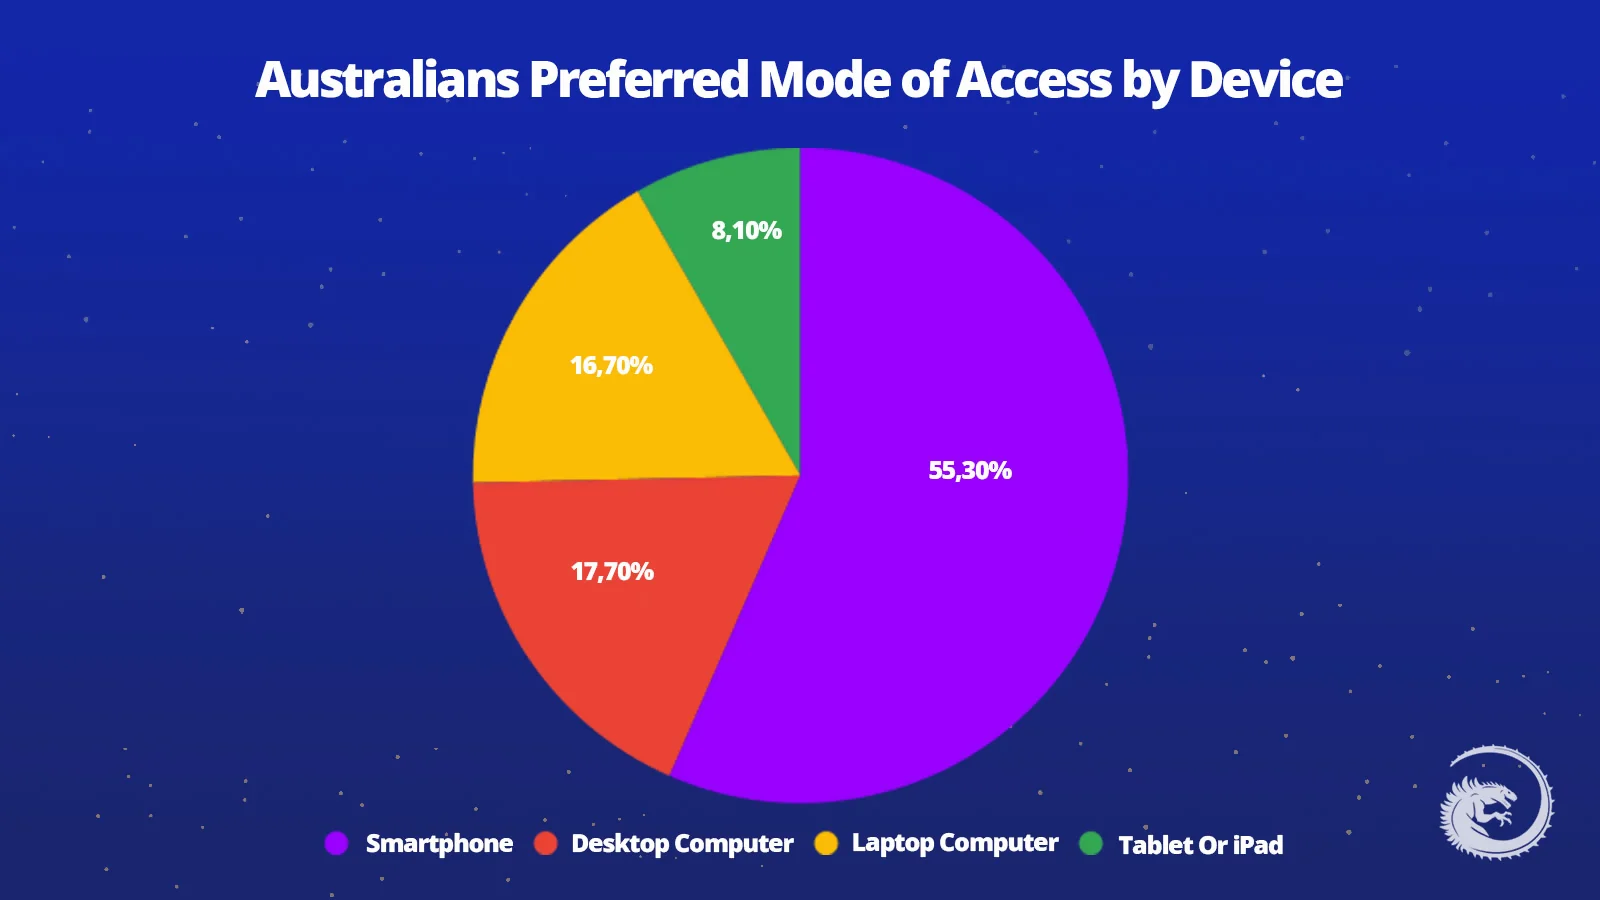
People have different preferences when it comes to the device they use to gamble. Most Australians use smartphones as their preferred mode of online gambling. This has been possible due to mobile-optimised sites that offer a comparable experience to playing on the desktop.
55.3% of the population use smartphones for online gambling, the rest used other devices including desktop computers, laptops and tablets gaming consoles as per 2019 stats.
Online Gambling Participation In Australia
The results of the broad statistics on gambling participation rate by Australians were not surprising. The gambling participation in Australia indicated an increase from 8.1% in 2011 to 17.5% in 2019, which is a whopping 116% increase. The future of gambling in Australia is slated to be big.
Worldwide Online Gambling Engagement Rates
In the infographic below you can find the gambling engagement rate among the adult population worldwide. According to research conducted in 2019, Norway and Finland showcase particularly high participation rates, while Australia shows 17.5%, meaning that nearly one-fifth of the adult population engages in online gambling activities.
It’s important to take into account that these indicators are not solely influenced by the popularity of gambling but are significantly shaped by the legal and regulatory frameworks in place. The statistics can be changed over the years depending on the jurisdictions’ policies and gambling industry development.


![The Richest Gamblers in the World [TOP 15]](https://www.slotozilla.com/au/wp-content/uploads/sites/35760/new_uploads/2024/02/blog-sz-au-1-280x209.webp)


